


The recent trade announcement between the U.S. and China reverses many of the tariffs that rattled financial markets beginning in April. This agreement, which lasts 90 days, lowers U.S. tariff rates on China from 145% to 30%, and China’s rates on U.S. goods to 10%. Along with tariff pauses on other trading partners, and a newly announced trade deal with the U.K., markets are hopeful that a drawn-out trade war is now off the table. What does this changing market narrative mean for long-term investors?
What markets dislike most are uncertainty and negative surprises. This is because markets often react to the worst-case scenarios immediately and adjust as more information becomes available. While the unexpected size and scope of the April 2 tariffs sparked a sharp market downturn, the recovery over the past several weeks has also been swift.
Markets are close to where they started the year and slightly above their pre-April 2 tariff announcement levels. This is a pattern that follows many other historical examples in which a remarkable change of outlook can occur very quickly once there is greater clarity. In other words, the recent tariff brouhaha is yet another reminder that it can be very dangerous to jump to conclusions about long-term outcomes from short-term news reports.
The U.S.-China agreement is a positive sign a broader deal can be reached
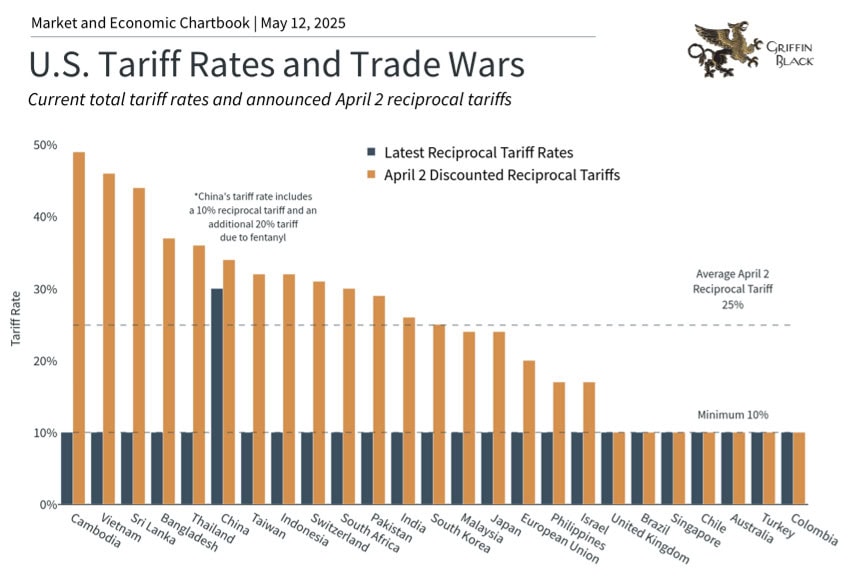
The latest tariff agreement between the U.S. and China is positive because it removes a significant source of market uncertainty. It sets the U.S. reciprocal tariff on Chinese goods to 10% while maintaining the 20% tariff related to the fentanyl crisis put in place earlier this year. While the situation is still evolving, this agreement paves the way for a longer-term trade deal between the world’s two largest economies and de-escalates tensions. So, while tariff rates are higher than in the past, the worst-case scenario is now less likely.
With the benefit of hindsight, recent events mirror the trade tensions in 2018 and 2019 during the first Trump administration. In both cases, the administration’s goal has been to achieve new trade deals by using tariffs as a negotiating tool, with the stated aim of closing the U.S. trade deficit with major trading partners. Five years ago, this resulted in the “Phase One” trade agreement with China, the USMCA (United States-Mexico-Canada Agreement), and other deals.
There are many intertwined objectives in these trade policies, including a focus on manufacturing jobs, protecting intellectual property, controlling immigration, and more. Today, the key difference is that the administration has gone much further with tariff threats than many investors and economists had anticipated. Still, the recently announced trade deal between the U.S. and the U.K. is evidence that previous patterns may apply here as well. That agreement sets a baseline 10% tariff rate on U.K. goods, with specific provisions allowing up to 100,000 imported cars at this level as well as exemptions for steel and aluminum.
The economy has been resilient despite trade uncertainty
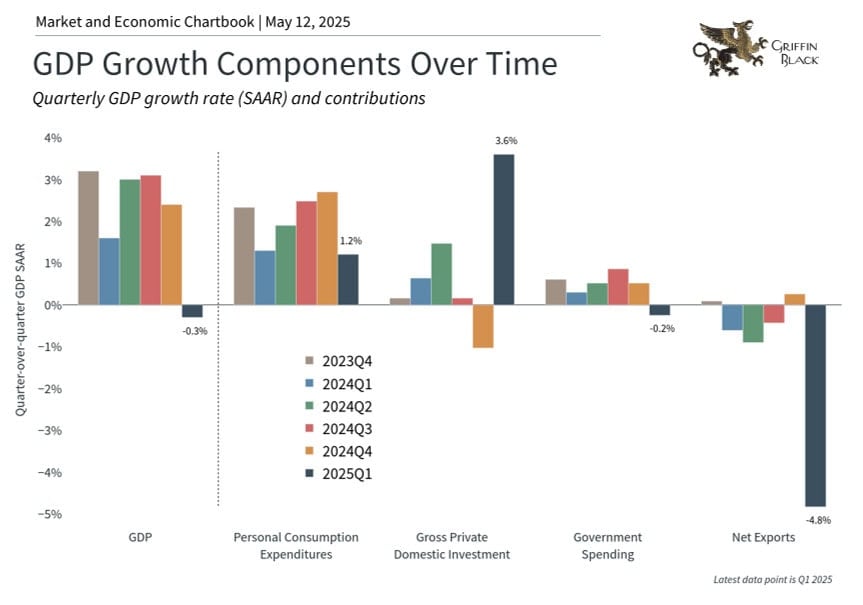
Of course, new trade deals with China and many other countries are not yet final, and day-to-day headlines could continue to drive market swings, especially if previous tariff pauses expire. An important reason markets have focused so heavily on tariffs is the impact on inflation and economic growth. This was reflected in the first quarter’s GDP figure which showed a slight economic contraction as businesses stockpiled imported goods ahead of tariff deadlines. Greater clarity will likely help both consumers and businesses.
In this environment, what else could go right? First, many economic indicators remain solid. The latest jobs report showed the economy added 177,000 positions in April, above expectations of 138,000. The unemployment rate held steady at 4.2%, continuing a period of stability that began last May. The strong job market helps to offset concerns that tariffs and uncertainty will impact consumer spending.
Meanwhile, inflation continues its gradual deceleration toward the Fed’s 2% target, with the latest Consumer Price Index figure coming in at 2.4% year-over-year. This deceleration has been supported by falling oil prices which recently reached four-year lows. Cheaper oil, driven in part by tariff-related volatility, helps to lower costs for consumers and can be a boost to the economy, all things equal.
The recent U.S.-China agreement also reduces the pressure for immediate Fed policy changes. Market-based measures still expect the Fed to cut rates further this year, but these expectations have fallen to only two or three cuts, possibly beginning in July or September. The Fed, which recently kept rates steady between 4.25% and 4.5%, appears to be taking a “wait-and-see” approach, rather than reacting to near-term trade, market, and economic news.
Market recoveries often occur when they’re least expected
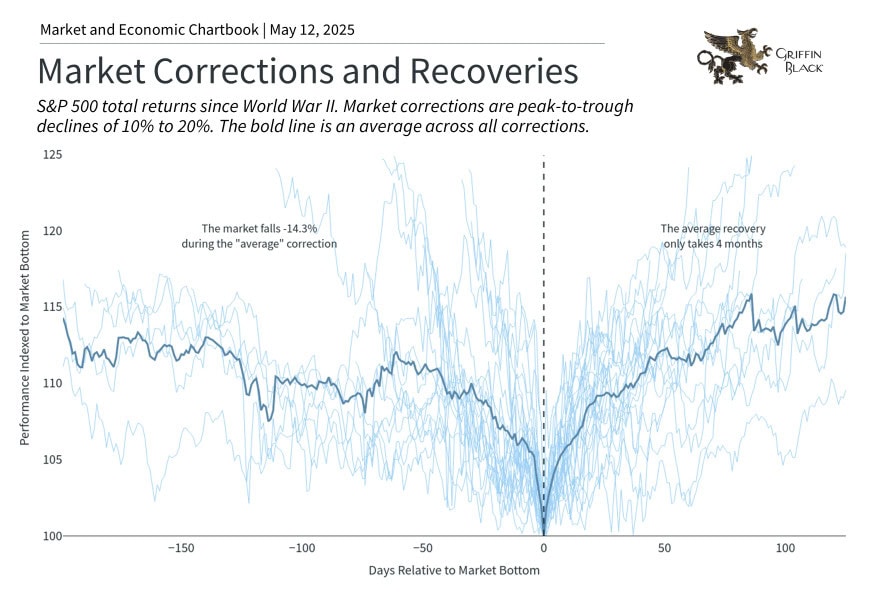
While there are still many risks to the market, the last several weeks show how quickly the narrative can change. By their very nature, markets anticipate worst-case scenarios. During times of negative headlines and market pullbacks, it’s difficult to imagine that the market will ever recover. So, while understanding risks is always prudent, it should not come at the expense of long-term portfolio positioning.
The accompanying chart shows how market corrections have behaved since World War II. While the average correction experiences a decline of 14%, it often recovers in as little as four months. Most importantly, it can often rebound when it’s least expected, as we’ve experienced following recent progress on trade negotiations. Those investors who overreact to early signs of volatility may find that they are not appropriately positioned, especially with respect to achieving their long-term financial goals.
That said, if you’re nearing retirement, a prudent move is to start thinking differently about the money you’re going to need to insulate from short-term market volatility versus the portion of your wealth that you want to continue to invest in long-term growth. That way you’ll have greater confidence in your ability to weather inevitable bouts of near-term volatility without sacrificing your target lifestyle, both now and over the long term.
For details, reach out to your Griffin Black Wealth Advisor. We’ll be glad to help.