





In our modern world, computers and cell phones have become everyday necessities that are expected to simply work. Yet, there is unbelievable complexity behind not only the engineering that makes them possible, but also in the supply chains that allow millions of devices to be manufactured.
Similarly, artificial intelligence (AI) may seem simple when using a chatbot, but there is a complex value chain that allows anyone with a device to access capabilities that would have seemed like science fiction less than a decade ago. This has made generative AI and large language models (LLMs) one of the most important themes currently driving financial markets and the economy. This also means it’s important to have a broader view of AI that goes beyond a few “AI stocks”.
While there is little doubt that AI is transformational, it remains difficult to forecast demand or determine how it will ultimately affect businesses, workers, and productivity in the years ahead. For investors, this uncertainty can make it difficult to value companies, sectors, and the overall stock market. How can investors better understand AI’s impact while maintaining a long-term perspective?
The entire AI supply chain is supporting markets
One of the most important insights for investors is that “AI” is not a single type of investment. While it’s natural to think of the model providers at the heart of these capabilities, such as OpenAI, Anthropic, and Google, they represent only one piece of the puzzle. There is a full supply chain that covers a range of activities, industries, and business models, each with its own characteristics and risks, including hardware, data centers, software providers, and more.
At the foundation is the semiconductor hardware that makes this all possible. There are two stages where hardware like GPUs and memory chips are needed. The first is model training to build LLMs, a process that uses huge amounts of data across thousands of connected servers, taking weeks or months to complete.
The second is known as “inference,” which is the actual use of these models by individuals and businesses. Each prompt requires computational and memory resources to generate an answer. The combination of training and inference is why demand and prices for this hardware have surged, leading to high market valuations.
Over time, the hardware required needs to be scaled up to meet demand, which is where data centers come in. Imagine a data center as a large warehouse packed from floor to ceiling with servers. These machines run 24/7, requiring security, electricity, and cooling. Altogether, data centers represent the enormous resources devoted to making AI applications possible.
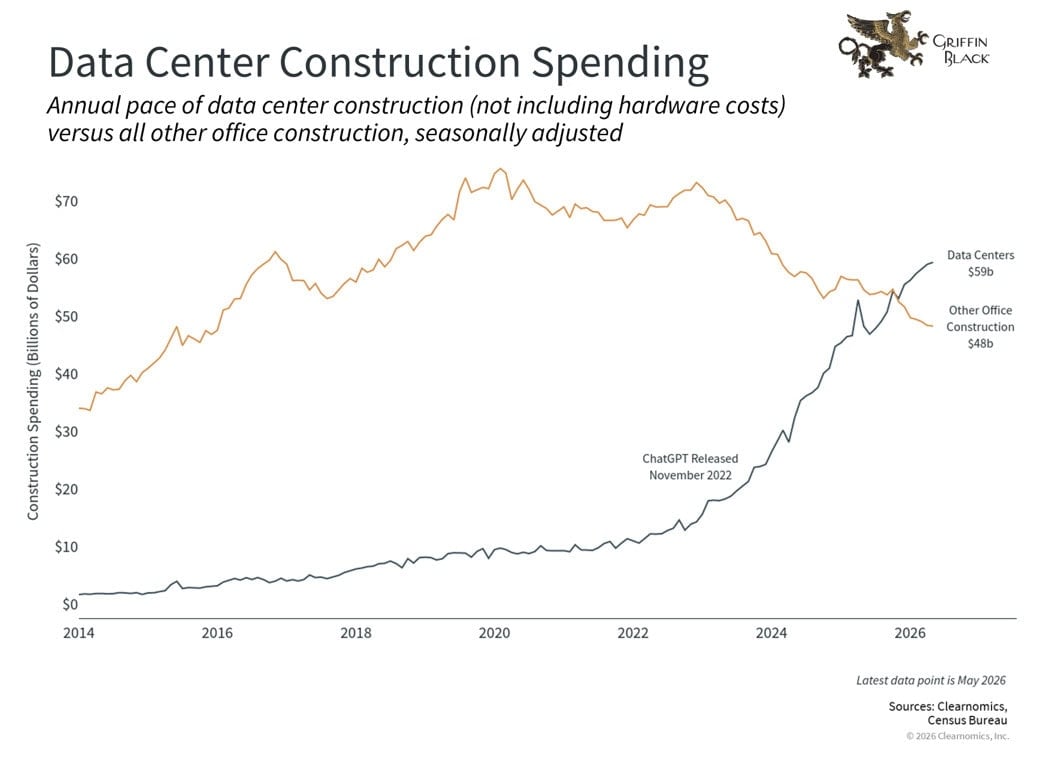
Spending on data centers has become a significant contributor to economic activity. The chart above shows the amount spent on data center construction, not including the IT hardware. It’s clear that this spending has accelerated since the launch of ChatGPT in late 2022. Indeed, it surpassed all other types of office construction during that period. It’s also important to note that not all of this growth is due to AI in a strict sense. General adoption of technology and automation, especially since 2020, has also led to greater demand for computational resources.1
Finally, there is the use of AI by businesses, both internally as well as AI that has been embedded in new applications by software providers. At the moment, this is perhaps the hardest to evaluate, since it depends on how effectively companies can turn AI capabilities into productivity gains and product enhancements. For instance, how AI interacts with existing software, and whether these companies will evolve, has been one source of market uncertainty over the past year.
Investors are weighing whether large investments will pay off2
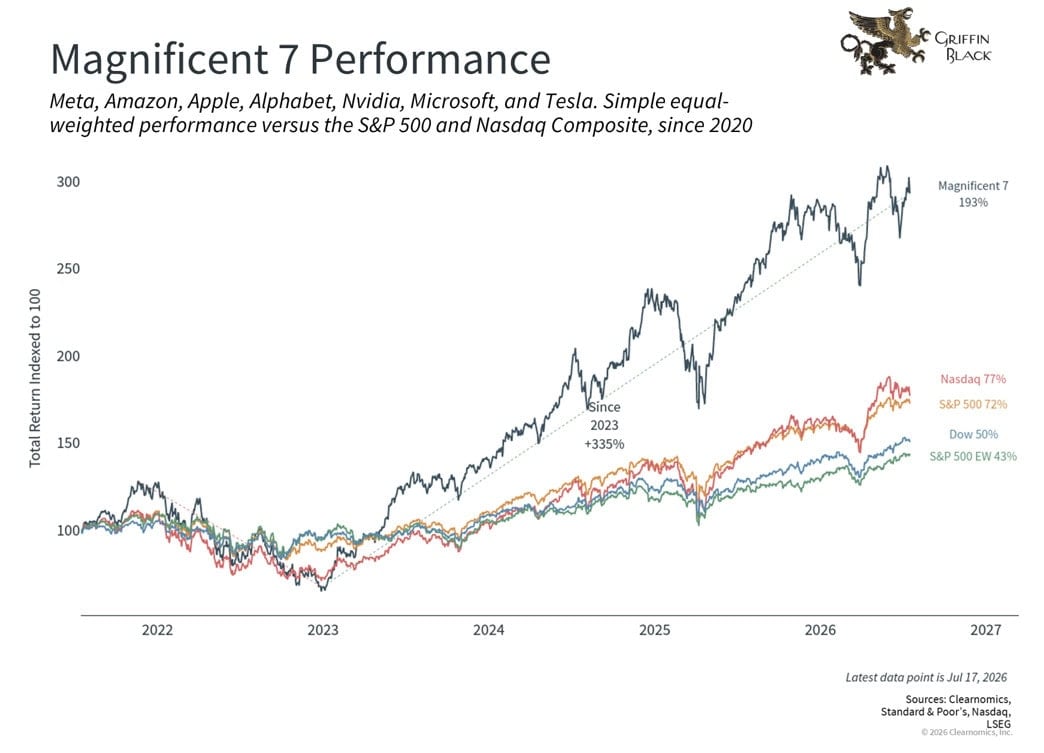
A central question facing investors right now is whether the hundreds of billions being spent on AI infrastructure will eventually generate sufficient returns. This is challenging due to the scale of these investments, particularly from the largest technology companies. On the one hand, the demand for computing power to train and run AI models has been substantial, supporting the companies that provide hardware and data center capacity. On the other hand, as models continue to improve, they may also become more efficient, potentially requiring less computing power for a given task over time.
This uncertainty helps explain some of the volatility in AI-related stocks. As the accompanying chart shows, mega-cap technology stocks have experienced strong returns over the past several years, but with large swings. Since it takes time to build new data centers, periods of optimism about infrastructure spending have been followed by periods of concern about whether there will be sufficient demand.
Since early 2025, for example, investors have been worried about more efficient AI models that might mean less computing power is required. However, history shows that the efficiency gains that come with new innovations do not always reduce overall demand, a phenomenon that is commonly referred to as the “Jevons paradox.” In some cases, cheaper and more capable technology leads to broader adoption and completely new use cases. For instance, electricity today is not just for light bulbs, and computers are not just for large companies.
At the same time, markets have a long track record of overestimating the speed at which new technologies generate profits, even when the long-term potential is real. The enthusiasm investors showed for internet stocks in the late 1990s and early 2000s took decades to truly play out. This is why it’s important to maintain not just a broader perspective on the companies involved in AI, but also a long-term perspective as both the technology and overall demand evolve.
Valuations reflect high expectations
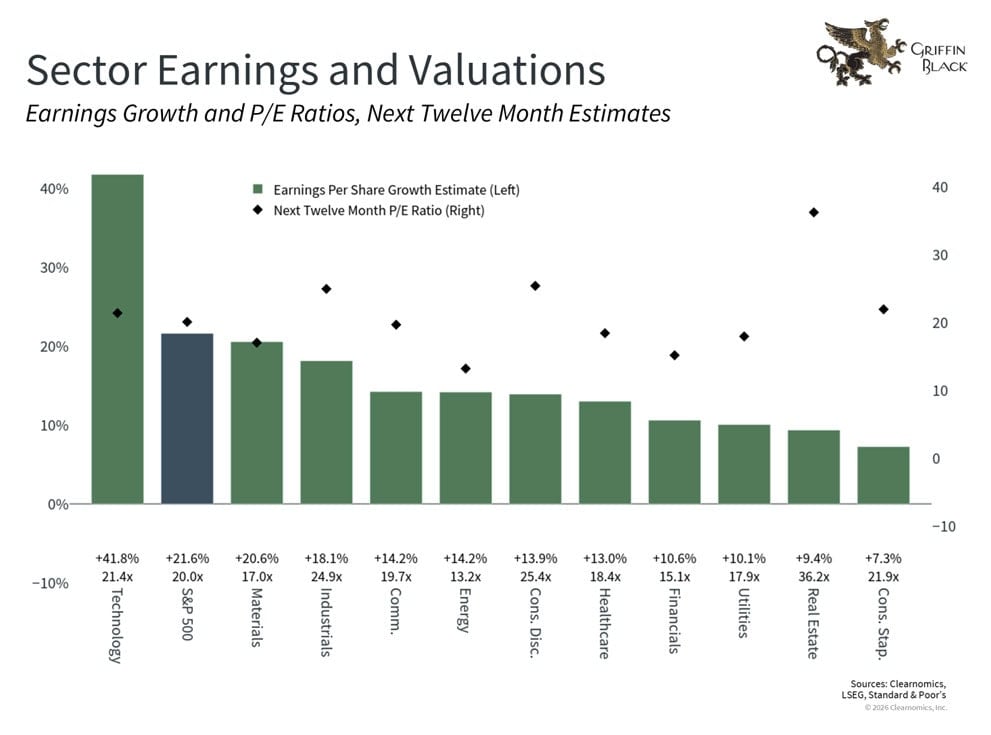
As AI has captured investor attention, valuations for many technology companies have risen steadily. As the chart above shows, Information Technology sector valuations, at 21.4x, are high relative to their own history and the broader market. The same is true for sectors such as Communication Services and Consumer Discretionary which also contain large tech companies. At the same time, these valuations also reflect strong earnings growth as demand for AI capabilities grows.3
It’s important to remember that valuations are not a tool for predicting what markets will do tomorrow. Instead, valuations reflect the market’s expectations and can therefore help us decide on an appropriate mix of assets in a portfolio. So, while AI trends provide potential opportunities for growth, many other sectors are attractively valued and have expected strong earnings growth as well. As always, the key is to maintain perspective, balancing the broad AI theme and other parts of the market as you work toward your financial goals.
References
- https://www.census.gov/construction/c30/c30index.html ↩︎
- The Magnificent 7 companies include Meta, Amazon, Apple, Alphabet, Nvidia, Microsoft, and Tesla. Data as of July 17, 2026 ↩︎
- Clearnomics research and LSEG data as of July 17, 2026 ↩︎
Index Descriptions
S&P 500
The Standard & Poor’s 500 Index is a capitalization-weighted index of 500 stocks designed to measure performance of the broad domestic economy through changes in the aggregate market value of 500 stocks representing all major industries.
NASDAQ
The NASDAQ Composite Index measures all NASDAQ domestic and non-U.S. based common stocks listed on The NASDAQ Stock Market. The market value, the last sale price multiplied by total shares outstanding, is calculated throughout the trading day, and is related to the total value of the Index