Nearly 10 years ago, in early October 2007, the S&P 500 Index hit what was its highest point before losing more than half its value over the next year and a half during the global financial crisis.
Over the coming weeks and months, there will likely be a steady stream of retrospectives on what happened and opinions on how the environment today may be similar or different from the period leading up to the crisis. It is difficult to draw useful conclusions based on such observations; financial markets have a habit of behaving unpredictably in the short run. There are, however, important lessons that investors might be well-served to remember: Capital markets have rewarded investors over the long term, and having an investment approach you can stick with—especially during tough times—may better prepare you for the next crisis and its aftermath.
Benefits of Hindsight
In 2008, the stock market dropped in value by almost half. Being a decade removed from the crisis may make it easier to take the past in stride. The eventual rebound and subsequent years of double-digit gains have also likely helped in this regard. While the events of the crisis were unfolding, however, a future of this sort looked anything but certain. Headlines such as “Worst Crisis Since ’30s, With No End Yet in Sight,”1 “Markets in Disarray as Lending Locks Up,”2 and “For Stocks, Worst Single-Day Drop in Two Decades,”3 were common on front pages. Reading the news, opening up quarterly statements, or going online to check an account balance were, for many, stomach-churning experiences.
While being an investor is by no means a worry-free experience, the feelings of panic and dread felt by many during the financial crisis were distinctly acute. Many investors reacted emotionally to these developments. In the heat of the moment, some decided it was more than they could stomach, so they sold out of stocks. On the other hand, many who were able to stay the course and stick to their approach recovered from the crisis and benefited from the subsequent rebound in markets.
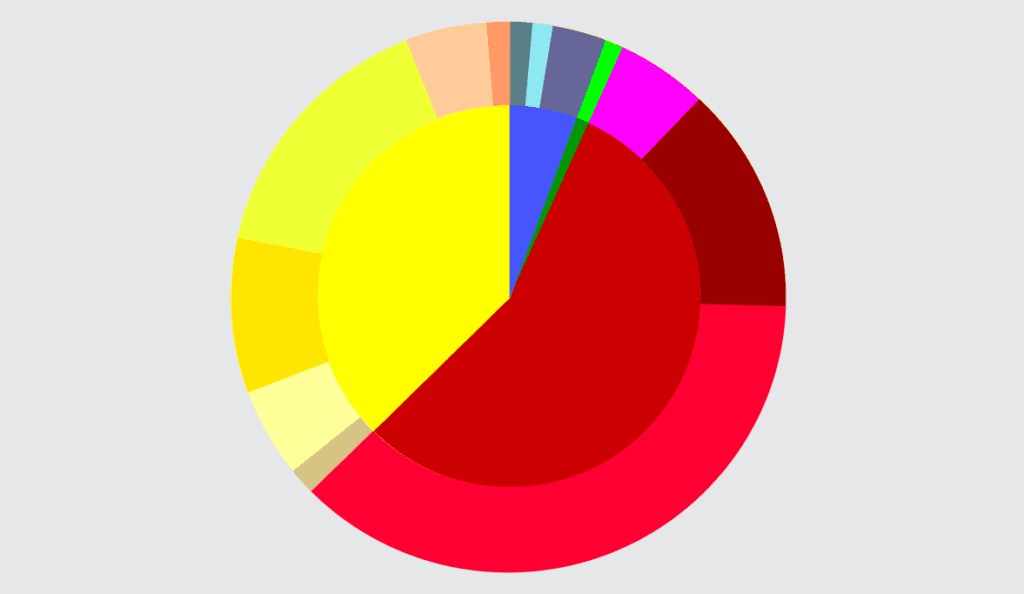
It is important to remember that this crisis and the subsequent recovery in financial markets was not the first time in history that periods of substantial volatility have occurred. Exhibit 1 helps illustrate this point. The exhibit shows the performance of a balanced investment strategy following several crises, including the bankruptcy of Lehman Brothers in September of 2008, which took place in the middle of the financial crisis. Each event is labeled with the month and year that it occurred or peaked.4

Performance of a Balanced Strategy: 60% Stocks, 40% Bonds (Cumulative Total Return)
Although a globally diversified balanced investment strategy invested at the time of each event would have suffered losses immediately following most of these events, financial markets did recover, as can be seen by the three- and five-year cumulative returns shown in the exhibit. In advance of such periods of discomfort, having a long-term perspective, appropriate diversification, and an asset allocation that aligns with their risk tolerance and goals can help investors remain disciplined enough to ride out the storm. A financial advisor can play a critical role in helping to work through these issues and in counseling investors when things look their darkest.
Conclusion
In the mind of some investors, there is always a “crisis of the day” or potential major event looming that could mean the beginning of the next drop in markets. As we know, predicting future events correctly, or how the market will react to future events, is a difficult exercise. It is important to understand, however, that market volatility is a part of investing. To enjoy the benefits of higher potential returns, investors must be willing to accept increased uncertainty. A key part of a good long-term investment experience is being able to stay with your investment philosophy, even during tough times. A well‑thought‑out, transparent investment approach can help people be better prepared to face uncertainty and may improve their ability to stick with their plan and ultimately capture the long-term returns of capital markets.
[4] In US dollars. Represents cumulative total returns of a balanced strategy invested on the first day of the following calendar month of the event noted. Balanced Strategy: 12% S&P 500 Index,12% Dimensional US Large Cap Value Index, 6% Dow Jones US Select REIT Index, 6% Dimensional International Marketwide Value Index, 6% Dimensional US Small Cap Index, 6% Dimensional US Small Cap Value Index, 3% Dimensional International Small Cap Index, 3% Dimensional International Small Cap Value Index, 2.4% Dimensional Emerging Markets Small Index, 1.8% Dimensional Emerging Markets Value Index, 1.8% Dimensional Emerging Markets Index, 10% Bloomberg Barclays Treasury Bond Index 1-5 Years, 10% Citigroup World Government Bond Index 1-5 Years (hedged), 10% Citigroup World Government Bond Index 1-3 Years (hedged), 10% BofA Merrill Lynch 1-Year US Treasury Note Index. The S&P data are provided by Standard & Poor’s Index Services Group. The Merrill Lynch Indices are used with permission; copyright 2017 Merrill Lynch, Pierce, Fenner & Smith Incorporated; all rights reserved. Citigroup Indices used with permission, © 2017 by Citigroup. Bloomberg Barclays data provided by Bloomberg. For illustrative purposes only. Dimensional indices use CRSP and Compustat data. Indices are not available for direct investment. Their performance does not reflect the expenses associated with the management of an actual portfolio. Past performance is not a guarantee of future results. Not to be construed as investment advice. Rebalanced monthly. Returns of model portfolios are based on back-tested model allocation mixes designed with the benefit of hindsight and do not represent actual investment performance.
Image by Skorzewiak from Shutterstock